4.5 Table, Arrays, Tabular and Tablularx
4.50 Table
A table is a float object. Tables inherit all the caveats applicable to float objects. The table command calls a hold-all environment or a container to hold other data structures. It is the basic structure of data presentation in any organized form. The only parameter it takes is the placement parameter. The table environment is native to LaTex; it does not need to be specifically invoked. The usual structure of initiating the table environment is
| 1. \begin{table}[placement parameter (htbp)] 2. \begin data structure (array, tabular, tabularx or tabularx*) 3. Data body 4. \end data structure 5. \end{table} |
Having set up a table environment at the top-most level, the underlying data and design considerations determine the type of sub-environments. For instance, the array environment is best suited for number-heavy data or scientific notations, because it accommodates maths mode. Tabular and Tabularx are two instances of text-dominant data presentations. The difference between the two is discussed later in section 4.53.1 and associated illustration.
4.51 Arrays: An array is an organised presentation of numbers and maths entries. This is important because the array command works only in the maths mode. An array environment is invoked with the command \begin {array}. But prior to calling the array environment, we have to invoke the maths mode with \[ or a $. Also, it is usual to center arrays and tables in the middle of the page with a \begin{center} prior to getting into the main array environment.
The array environment allows for data in multi-column structures to be aligned in a manner that the presentation is aesthetically pleasing and the data can be assimilated without ambiguity. The alignment for each column in a multi-column array is specified at the invocation of the array environment itself like so: \begin{array}{x}, where {x} is a column specifier which can take one of three options:
- l: left aligned column
- r: right aligned column
- c: centered (within column)
Once the structure is specified, data is input line-wise, with fields separated with a &, like so for a three column array: 'Left entry & center entry & right entry\\'. The two backslashes have the usual effect of introducing a line break. The code below produces the output in Figure 4.51
| 1. \documentclass{article}[12pt] 2. \pagestyle{empty} %supresses page numbering 3. \usepackage[margin=1in]{geometry} %margin set at 2in on all sides 4. \begin{document} 5. \begin{center} 6. $ % initiate maths mode 7. \begin{array}{lccccc} %invoke array environment; set up is six columns; first column is left aligned {l}, rest are center aligned {c} 8. \multicolumn{6}{c}{\LARGE{{\textbf{Planetary Fact Sheet--Metric}}} }\\[10pt] %Header row set as single column,, spanning the six text columns {6}, text is centered {c}; last {} contains header matter 9. &\textbf{ Mercury} & \textbf{ Venus} &\textbf{ Earth} &\textbf{ Moon} & \textbf{ Mars}\\ [10pt] 10. \hline\\ %manually added an extra line after hline 11. Mass (10^{24}kg) & 0.330 & 4.87 & 5.97 & 0.073 & 0.642\\[10pt] 12. Diameter (km) & 4879 & 12,104 &12,756 & 3475 &6792\\[10pt] 13. Density (kg/m^{3}) & 5429 & 5243 & 5514 & 3340 &3934\\ [10pt] 14. Gravity (m/s^{2})&3.7 & 8.9& 9.8& 1.6 &3.7\\ 15. Escape Velocity (km/s^{2})& 4.3 & 10.4 & 11.2 & 2.4 & 5.0\\ 16. Rotation Period (hours) & 1407.6 & -5832.5 &23.9 &655.7 & 24.6\\[10pt] 17. Length of Day (hours)& 4222.6& 2802.0 & 24.0 & 708.7 & 24.7\\[10pt] 18. Distance from Sun (10^{6} km) & 57.9 & 108.2 & 149.6 & 0.384*& 228.0\\[10pt] 19. \hline\\ 20. \multicolumn{6}{l}{\textit{Source: NASA}} 21. %added multi-column row, spanning six text column {6}, aligned left {l} to accommodate Source statement 22. \end{array} 23. $ 24. \end{center} 25. \end{document} |
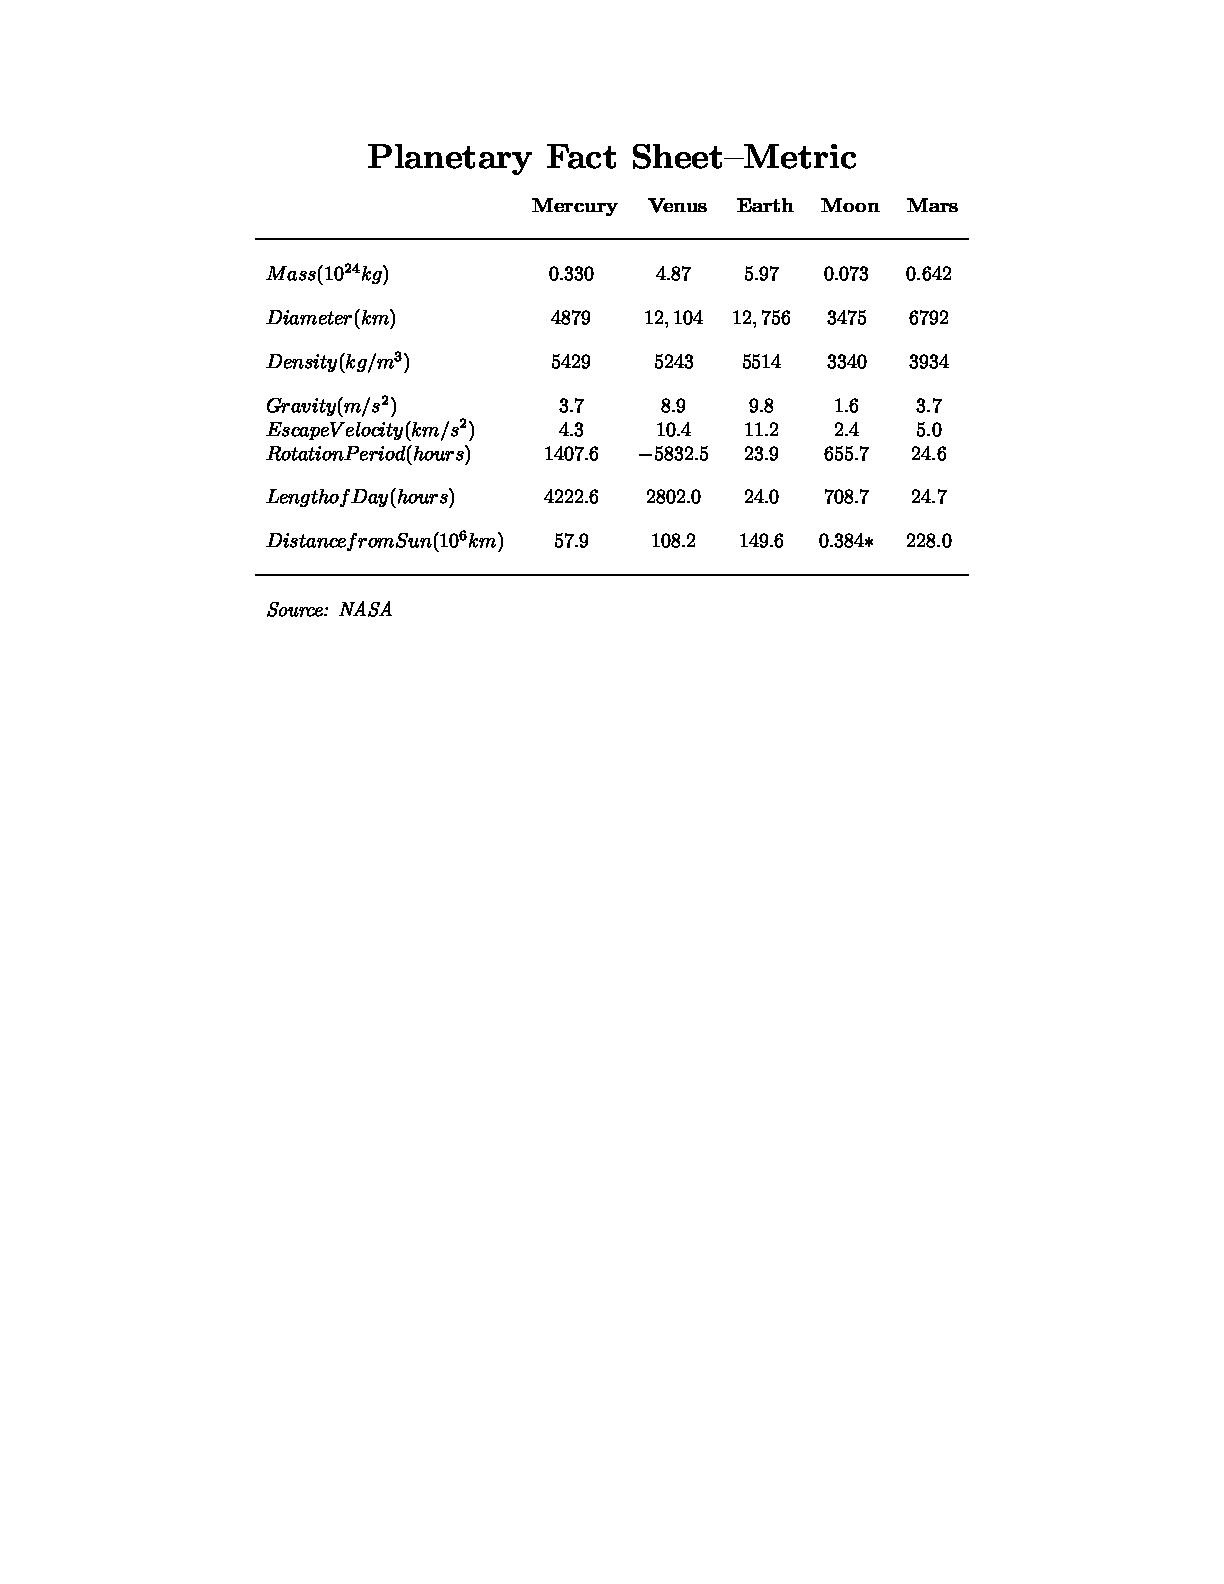 |
Figure 4.51 The array environment
4.52 Tabular
The data structure in this sub-section is tabular and not table. The difference is profound.
The array environment (sub-section 4.51) is a data structure in the maths mode to store numbers. The tabular environment on the other hand is for text data, which means it has all the commands and accompaniments that are needed for the proper display of text data. Beyond that, the rest of the steps in setting up the text structure are the same.
Figure 4.52 illustrates the page output from the code snippet below.
| 1. \documentclass{article}[12pt] 2. \pagestyle{empty} %supresses page numbering 3. \usepackage[margin=0.5in]{geometry} 4. \begin{document} 5. \begin{center} 6. \begin{tabular} {p{1cm} p{2cm} p{2.2cm} p{4cm} p{1.5cm}} \\ 7. %Tabular invoked with five columns, of fixed widths 8. \multicolumn{5}{c}{\LARGE{{\textbf{2023 F1 Driver Standings}}} }\\[10pt] 9. %First row set as header row, single column, spanning the five text columns {multticolumn{5}, text is center aligned {c}}; extra spacing added after top row (\\[10pt]) 10. \textbf{Pos} &\textbf{ Driver} & \textbf{ Nationality} &\textbf{Team} &\textbf{ Points} \\ 11. \hline\\ 12. 1& Max Verstappen & Netherlands& Red Bull Racing Honda Powertrain & 314\\ 13. 2& Sergio Perez& Mexico & Red Bull Racing Honda Powertrain & 189\\ 14. 3 & Fernando Alonso & Spain &Aston Martin- Aramco Mercedes & 149\\ 15. 4 & Lewis Hamilton & Great Britain & Mercedes & 148\\ 16. 5 & Charles Leclerc& Monagsque & Ferrari & 99\\ 17. & George Russell& Great Britain & Mercedes& 99\\ 18. 7 & Carlos Sainz& Spain& Ferrari & 92\\ 19. 8 & Lando Norris& Great Britain &Mclaren Mercedes &69\\ 20. 9 &Lance Stroll& Canada &Aston Martin Aramco Mercedes & 47\\ 21. 10 &Esteban Ocon & France & Alpine Renault& 35\\ 22. 11& Oscar Piastri& Austria & Mclaren Mercedes& 34\\ 23. 12 &Pierre Gasly& France &Alpine Renault & 22\\ 24. 13& Alexander Albon & British-Thai& Williams Mercedes& 11\\ 25. 14 &Nico Hulkenberg& Germany& Haas Ferrari & 9\\ 26. 15& Valtteri Bottas& Finland & Alfa Romeo Ferrari& 5\\ 27. 16 & Zhou Guanyu & China & Alfa Romeo Ferrari&4\\ 28. 17 &Yuki Tsunoda & Japan &AlphaTauri--Honda Powertrain& 3\\ 29. 18& Kevin Magnussen &Denmark & Has Ferrari& 2\\ 30. 19 & Logan Sargeant & USA & Wiliams Mercedes &0\\ 31. 20& Nyck De Vries &Neherlands & Alphatauri--Honda Powertrain& 0\\ 32. 21& Daniel Ricciardo& Austria & AlphaTauri-HondaPowertrain&0\\ 33. \hline 34. \par\\ 35. \multicolumn{5}{l}{\textit{Source: Formula 1.com}} 36. % multi-column row, spanning all ive columns{5}; left text aligned {l} toacomodate source and copyright information 37. \end{tabular} 38. \end{center} 39. \end{document} |
 |
Figure 4.52 Tabular environment, with fixed width columns
4.53 Tabularx
Tabularx is not a derivative of tabular. It is not an alternative for all seasons and all reasons. It is actually the tabular environment plus plus, designed for greater user control over the table output. It loads the array package at start, bringing the added flexibility of dealing with tables, column widths and column headers.
Here is a quick comparison.
The tabularx command takes only one parameter, the desired width of the table, as per page design considerations. As discussed later, the tabularx engine adjusts column widths to fit the columns to the overall table width. The tabularx environment is called as under:
\begin{tabularx}{\textwidth}
This sets the table width to fit the exact text width. Design specifications of 0.80\textwidth or 0.50\textwidth will output tables of fixed size, so that the user can place the other design elements around the table, without concerns of overlap or white spaces. In academic papers with two- column formats and a gutter, the table has to be set within the exact specs of the column text width. So also, in in the book or report documentclass where the tables are set to fit the pagewidth.
The Figure 4.53.0 below illustrates the stretch mechanism which returns equally spaced columns. The three tables are set at 70%, 85% and 100% of text width.
| 1 \documentclass{article}[10pt] 2 \pagestyle{empty} %supresses page numbering 3 \usepackage[margin=1in]{geometry} 4 \usepackage{tabularx,array,float} 5 \setlength{\textfloatsep}{0.5cm} 6 \begin{document} 7 \begin{table}[htbp] 8 %70per cent of text width 9 \begin{tabularx}{0.7\textwidth}{XXXX} % see section for discussion of X columnspec 10 \multicolumn{4}{c}{\LARGE{Active Inter-stellar Space Probes}}\\ [12pt] % adds 12 pt spacig after carriage return 11 \textbf{Mission} & \textbf{Launch date} & \textbf{Space Agency} & \textbf{Highlights}\\ 12 \hline\\ 13 \textbf{Voyager-1} & September 5, 1977 & NASA & Farthest man-made object from the Earth\\ 14 \textbf{Voyager-2} & August 20, 1977 & NASA & Voyager-2 was actually launched first\\ 15 \textbf{New Horizons} & January 19, 2006 & NASA & First mission to Pluto, continued to Kuiper Belt \\[3pt] 16 \hline 17 \bigskip\\ 18 \end{tabularx} 19 \end{table} 20 \vspace{0.5cm} 21 %Second table, 85 per cent of text width 22 \begin{tabularx}{0.85\textwidth}{XXXX} 23 \textbf{Mission} & \textbf{Launch date} & \textbf{Space Agency} & \textbf{Highlights}\\ 24 \hline\\ 25 \textbf{Voyager-1} & September 5, 1977 & NASA & Farthest man-made object from the Earth\\ 26 \textbf{Voyager-2} & August 20, 1977 & NASA & Voyager-2 was actually launched first\\ 27 \textbf{New Horizons} & January 19, 2006 & NASA & First mission to Pluto, continued to Kuiper Belt \\ 28 \hline% 29 \end{tabularx} 30 \vspace{0.5cm} 31 %Third table, 100% text width 32 \begin{table}[htbp] 33 \begin{tabularx}{\textwidth}{XXXX} 34 \textbf{Mission} & \textbf{Launch date} & \textbf{Space Agency} & \textbf{Highlights}\\ 35 \hline\\ 36 \textbf{Voyager-1} & September 5, 1977 & NASA & Farthest man-made object from the Earth\\ 37 \textbf{Voyager-2} & August 20, 1977 & NASA & Voyager-2 was actually launched first\\[10pt] 38 \textbf{New Horizons} & January 19, 2006 & NASA & First mission to Pluto, continued to Kuiper Belt \\ 39 \hline% 40 \bigskip 41 \multicolumn{4}{l}{\textbf{\textit{Source:}The Planetary Society and NASA Wiki }}\\ 42 \end{tabularx} 43 \end{table} 44 \end{document} |
 |
Figure 4.53.0: Illustration of tabularx output with table width set at 70%, 85% and 100% (top to bottom)
The tabularx package modifies the basic p column type (column with width specification) into a new column type called X. The tabularx call has two parameters:
- The overall width of the intended table;
- The specs of the columns within.
A typical call with the X column is reported in line 7 of the tabularx code:
\begin{tabularx}{\textwidth}{XXXX}
In Figure 4.53.1 (right column, below), line 7, the table is set for 100% of the text width; four columns are specified, each of type x.
The use of the X column specification instructs the compiler to automatically calculate the widths of each of the X columns to add up to the overall target width. It follows, therefore, that each tabularx call must have one x column. Since the width of all x columns is compiler-calculated, all x columns will have the same width.
In a mixed column specification, this calls for serious consideration: the tabularx distributes the white space not needed by columns of fixed width is distributed evenly to the columns of type x.
In tabular, on the other hand, the table width is determined by the compiler to best suit the available text/column contents.
Tabularx, with its internal stretch mechanism, returns a common column width for all columns despite differences in column contents. This leaves lots of white spaces, lending an open look to the table. Design gurus prefer this open look to the ruled and boxed look of earlier decades.
o However, there may be occasions to prefer compactly designed tables, and the choice of tabular environment.
The code snippet and the output Figure 4.53.1 below illustrate the differences between tabular and tabularx.
| Tabular environment | Tabularx environment |
| 1. \documentclass{article}[12pt] 2. \pagestyle{empty} %supresses page numbering 3. \usepackage[lmargin=1in, tmargin=1in, rmargin=1.5in, bmargin=1.5in]{geometry} 4. \begin{document} 5. \begin{center} 6. \begin{tabular}{p{0.8in} p{0.7in} p {1.0 in} p{0.5in} p{2.7in} } % Columns are of pre-defined width 7. \multicolumn{5}{c}{\LARGE{All Inter-stellar Space Probes}}\\[10pt] 8. \textbf{Mission} & \textbf{Launch date} & \textbf{Termination date} & \textbf{Space Agency} & \textbf{Highlights}\\ 9. \hline\\ 10. \textbf{Pioneer 10} & March 2,1972 & 2003& NASA & First spacecraft to traverse the asteroid belt and fly by Jupiter\\[10pt] 11. \textbf{Pioneer 11} & April 5, 1973 & 1995 & NASA & First probe to do a flyby of Saturn\\[10pt] 12. \textbf{Voyager-1} & September 5, 1977 & Active& NASA & Farthest man-made object from the Earth\\[10pt] 13. \textbf{Voyager-2} & August 20, 1977 & Active& NASA & Voyager-2 was actually launched first\\[10pt] 14. \textbf{New Horizons} & January 19, 2006& Active & NASA & First mission to Pluto, continued to Kuiper Belt\\[20pt] 15. \hline\\ 16. \multicolumn{5}{l}{\textit{Source:The Planetary Society and NASA WIKI}} 17. \end{tabular} 18. \end{center} 19. \end{document} |
1. \documentclass{article}[12pt] 2. \pagestyle{empty} %supresses page numbering 3. \usepackage[lmargin=1in, tmargin=1in, rmargin=1.5in, bmargin=1.5in]{geometry} 4. \usepackage{ caption, tabularx,array} 5. \makeatother 6. \begin{document} 7. \begin{tabularx}{\textwidth}{XXXX} % see section for discussion of X columnspec 8. \multicolumn{4}{c}{\LARGE{Active Inter-stellar Space Probes}}\\[10pt] % adds 10 pt spacig after carriage return 9. \textbf{Mission} & \textbf{Launch date} & \textbf{Space Agency} & \textbf{Highlights}\\ [10pt] 10. \hline\\ 11. \textbf{Voyager-1} & September 5, 1977 & NASA & Farthest man-made object from the Earth\\[10pt] 12. \textbf{Voyager-2} & August 20, 1977 & NASA & Voyager-2 was actually launched first\\[10pt] 13. \textbf{New Horizons} & January 19, 2006 & NASA & First mission to Pluto, continued to Kuiper Belt \\ 14. \bigskip\\ %adds a 12 pt verticalspace 15. \hline 16. \bigskip\\ 17. \multicolumn{4}{l}{\textbf{Source: Planetary Society and NASA Wiki}}\\ 18. \end{tabularx} 19. \end{document} |
| Note the columns of equal width below, which leaves lots of white space. This space could be optimised to accommodate the last column, as in the tabular table to the left |
 |
 |
Figure 4.53.1: Column widths in tabular and tabularx environments
4.54 Tabularx*:
The tabularx* command works on the table columns by changing the inter-column whitespace. This is a fine design consideration. The tabularx* call compares with the tabularx call which works by changing the column widths. In practice, the two environments can produce fairly similar looking results in some cases and rather different results in others.